Risk management
Organization of risk management
For FMO, acting in its role as Fund Manager (hereafter ‘FMO’) to be able to carry out the Fund’s strategy, it is essential to have an adequate risk management system in place to identify, measure, monitor and mitigate financial and non- financial risks. Building Prospects (hereafter ‘the Fund’) has a pre-defined risk appetite translated into limits for group, customer, country, region, and currencies exposures. Limit usages are monitored monthly and for each proposed transaction.
The Fund Manager reviews each transaction and provides consent to eligible proposals. The Investment Committee, comprising of senior representatives of several departments, reviews financing proposals for new transactions. Each financing proposal is assessed in terms of specific counterparty, product risk as well as country risk. All financing proposals are accompanied by the advice of the Credit department. This department is responsible for credit risk assessment of both new transactions and the existing portfolio. For small exposures, Credit department has the authority to review new transactions.
In addition, financial exposures in emerging markets are subject to a periodic review, which are in general executed annually. Exposures that require specific attention are reviewed by the Investment Review Committee (IRC). The larger and higher risk exposures are accompanied by the advice of the Credit department. If the Investment Review Committee concludes that a customer has difficulty in meeting its payment obligations, the customer is transferred to the Special Operations department – responsible for the management of distressed assets – where it is intensely monitored.
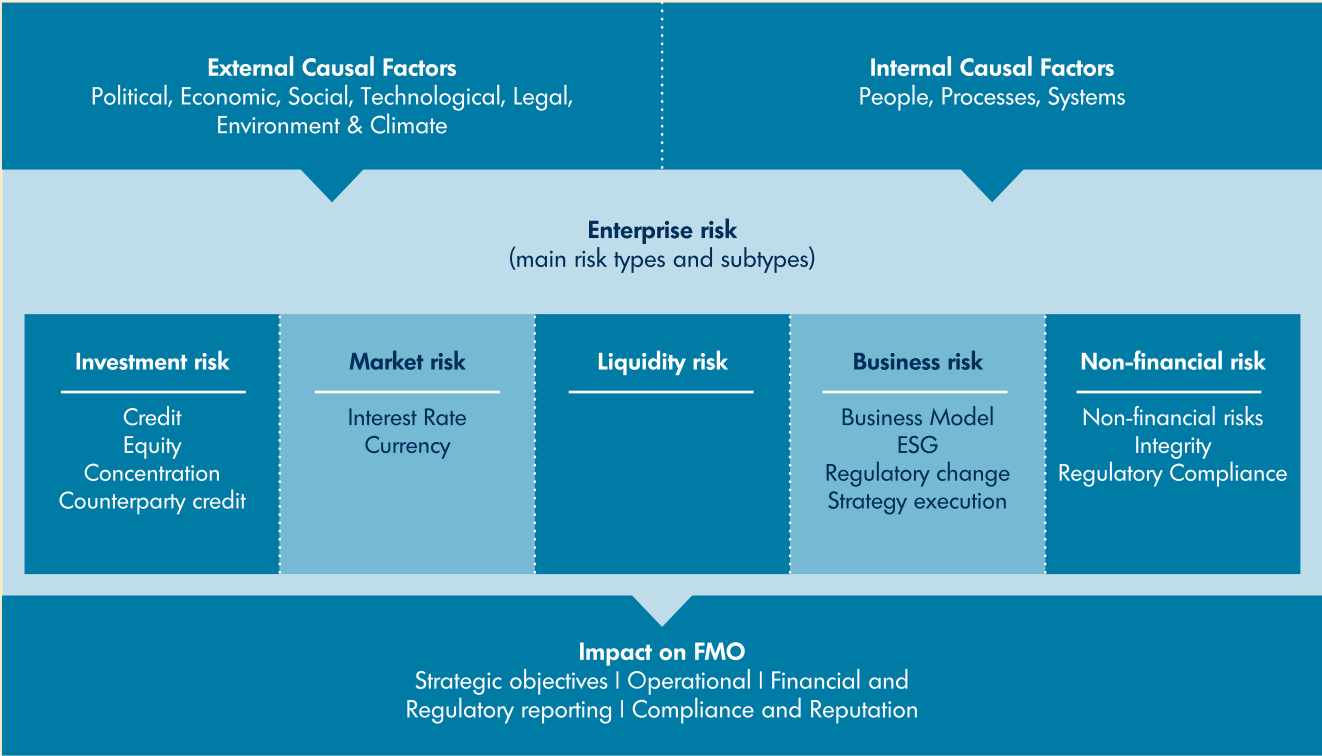
Risk taxonomy framework FMO
Risk profile & appetite
The Fund actively seeks to take risk stemming from debt and equity investments in private institutions in developing countries. This risk profile is supported by maintaining prudent levels of capital and liquidity and strong diversification of the portfolio across regions and sectors.
Capital management
The Fund aims to optimize development impact. This can only be achieved with a sound financial framework in place, combining a healthy long-term revolvability of ≥100% and sound capital adequacy. Therefore, FMO seeks to maintain a strong capital position for the Fund. The Fund’s structure is based on a 100% contribution from the Dutch government. Total contribution from the Dutch government is €394.5 million at 31 December 2021 (31 December 2020: €384.5 million). Total fund capital – which is the sum of the contribution by the government, undistributed results from previous years, results from the current year, development contribution and evaluation costs – increased to €338.3 million in 2021 (2020: €312 million).
Financial risk
Investment risk
Investment risk is defined as the risk that actual investment returns will be lower than expected returns, and includes credit, equity, concentration, and counterparty credit risks.
Credit risk
Credit risk is defined as the risk that the Fund will suffer economic loss because a counterparty cannot fulfill its financial or other contractual obligations arising from a financial contract. Credit risk is the main risk within the Fund and occurs in two areas of its operations: (i) credit risk in investments in emerging markets and off-balance instruments such as loan commitments; and (ii) credit risk in the treasury portfolio, only consisting of bank accounts and money market instruments.
Management of credit risk is FMO’s core business, both in the context of project selection and project monitoring. In this process, a set of investment criteria per sector is used that reflects benchmarks for the required financial strength of FMO’s customers. This is further supported by internal scorecards that are used for risk classification and the determination of economic capital use per transaction. As to project monitoring, the Fund’s customers are subject to periodic reviews. Credit policies and guidelines are reviewed regularly and approved by the IRC.
Developments
FMO has embarked on an overhaul of its credit risk policy and processes. The objective is to implement a more aligned and effective portfolio management framework across the organization. Implementation has started in 2021 via the Investment Risk Project, which will continue further in 2022.
In the first half of 2020, a management overlay ('country crisis override') was introduced to reflect the impact of significant increases in credit risk on certain exposures of the loan portfolio, as a result of COVID-19. The overlay has been removed in 2021.
Credit risk in the emerging markets loan portfolio
The Fund offers loans in emerging market countries. Strong diversification within the Fund’s emerging market portfolio is ensured through stringent limits on individual counterparties (single customer limit of 10% of the Fund’s capital), countries and sectors (max. 40% of the annually available budget to be invested in one sector, fund, or country).
Internal credit approval process
Credit risk from loans in emerging market countries arises from a combination of counterparty risk, country risk and product specific risks. These types of risk are assessed during the credit approval and credit review process and administrated via internal scorecards. The lending process is based on formalized and strict procedures. Decisions on authorizations depend on both the amount of economic capital and the risk profile of the financing instrument. For distressed assets, the Special Operations department applies an advanced workout and restructuring approach.
In measuring the credit risk of the emerging market portfolio at counterparty level, the main parameters are the credit quality of counterparties and the expected recovery ratio in case of defaults. Counterparty credit quality is measured by scoring counterparties on various dimensions of financial strength. Based on these scores, FMO assigns ratings to each counterparty on an internal scale from F1 (lowest risk) to F20 (default), equivalent to a scale from AAA to C ratings.
Maximum exposure to credit risk | ||
2021 | 2020 | |
On balance | ||
Banks | 30,020 | 24,204 |
Short-term deposits | 14,082 | 9,833 |
Derivative financial instruments | 2,988 | 2,780 |
Loans to private sector | ||
-of which: Amortized cost | 179,617 | 175,036 |
-of which: Fair value through profit or loss | 74,717 | 82,489 |
Current account with FMO | 76 | 23 |
Other receivables | 134 | 581 |
Total on-balance | 301,634 | 294,946 |
Off-balance | ||
Irrevocable facilities | 38,829 | 34,637 |
Total off-balance | 38,829 | 34,637 |
Total credit risk exposure | 340,463 | 329,583 |
Credit quality analysis
In addition to on balance loans, irrevocable facilities (off-balance) represent commitments to extend finance to customers and consist of contracts signed but not disbursed yet which are usually not immediately and fully drawn.
The following tables provide insights in the credit risk allocation of loan portfolio and loan commitments according to internal ratings.
Loan portfolio at December 31, 2021 | Stage 1 | Stage 2 | Stage 3 | Fair Value | Total |
F1-F10 (BBB- and higher) | - | - | - | - | - |
F11-F13 (BB-,BB,BB+) | 16,118 | - | - | 13,135 | 29,253 |
F14-F16 (B-,B,B+) | 19,262 | 16,849 | - | 24,850 | 60,961 |
F17 and lower (CCC+ and lower) | - | 7,548 | 119,836 | 36,736 | 164,120 |
Sub-total | 35,380 | 24,397 | 119,836 | 74,721 | 254,334 |
Less: amortizable fees | -238 | -146 | -294 | - | -678 |
Less: ECL allowance | -556 | -1,694 | -96,145 | - | -98,395 |
Plus: FV adjustments | - | - | - | -11,055 | -11,055 |
Carrying value | 34,586 | 22,557 | 23,397 | 63,666 | 144,206 |
Loans commitments at December 31, 2021 | Stage 1 | Stage 2 | Stage 3 | Other1 | Total |
F1-F10 (BBB- and higher) | - | - | - | - | - |
F11-F13 (BB-,BB,BB+) | 15,642 | - | - | 9,613 | 25,255 |
F14-F16 (B-,B,B+) | 6,699 | - | - | 6,611 | 13,310 |
F17 and lower (CCC+ and lower) | - | - | - | 264 | 264 |
Total nominal amount | 22,341 | - | - | 16,488 | 38,829 |
ECL allowance | -73 | - | - | - | -73 |
Total | 22,268 | - | - | 16,488 | 38,756 |
- 1 Other loan commitments consist of transactions for which no ECL is calculated.
Loan portfolio at December 31, 2020 | Stage 1 | Stage 2 | Stage 3 | Fair Value | Total |
F1-F10 (BBB- and higher) | - | - | - | 1,230 | 1,230 |
F11-F13 (BB-,BB,BB+) | 34,819 | - | - | - | 34,819 |
F14-F16 (B-,B,B+) | 28,553 | 3,639 | - | 59,830 | 92,022 |
F17 and lower (CCC+ and lower) | - | 8,306 | 108,965 | 12,961 | 130,232 |
Sub-total | 63,372 | 11,945 | 108,965 | 74,021 | 258,303 |
Less: amortizable fees | -586 | -68 | -259 | - | -913 |
Less: ECL allowance | -845 | -759 | -85,782 | - | -87,386 |
Plus: FV adjustments | - | - | - | -1,862 | -1,862 |
Carrying value | 61,941 | 11,118 | 22,924 | 72,159 | 168,142 |
Loans commitments at December 31, 2020 | Stage 1 | Stage 2 | Stage 3 | Other1 | Total |
F1-F10 (BBB- and higher) | - | - | - | - | - |
F11-F13 (BB-,BB,BB+) | 9,870 | - | - | - | 9,870 |
F14-F16 (B-,B,B+) | 7,083 | - | - | 15,058 | 22,141 |
F17 and lower (CCC+ and lower) | - | - | - | 2,044 | 2,044 |
Total nominal amount | 16,953 | - | - | 17,102 | 34,055 |
ECL allowance | -135 | - | - | - | -135 |
Total | 16,818 | - | - | 17,102 | 33,920 |
- 1 Other loan commitments consist of transactions for which no ECL is calculated.
Non-Performing loans
Non-Performing Loans (NPL) are defined when any of the following occur:
When FMO judges that the customer is "unlikely to pay" its credit obligation to FMO and IRC decides on a specific impairment on a loan (Stage 3);
Loans with interest, principal or fee payments that are past due for more than 90 days (Stage 3);
One of the loans is classified as non-performing due to criteria mentioned above, all loans of the customer will be identified as non-performing (Stage 3);
Forborne exposures which are economically performing but are still in probation (curing) period due to Regulatory Standards (Stage 2). Probation period before returning to performing status is one year;
Additional forbearance measures are applied for forborne performing loans which have exited the NPL probation (Stage 2);
Performing forborne loans which have exited the NPL probation period have past due amounts for more than 30 days (Stage 2).

The Fund's NPL ratio increased from 45.4% (2020) to 61.9% (2021), mainly due to additional impairments.
Loans past due and impairments 2021 | |||||
Stage 1 | Stage 2 | Stage 3 | Fair value | Total | |
Loans not past due | 35,380 | 24,397 | 10,537 | 68,724 | 139,038 |
Loans past due: | |||||
-Past due up to 30 days | - | - | - | - | - |
-Past due 30-60 days | - | - | - | - | - |
-Past due 60-90 days | - | - | - | 5,997 | 5,997 |
-Past due more than 90 days | - | - | 109,299 | - | 109,299 |
Subtotal | 35,380 | 24,397 | 119,836 | 74,721 | 254,334 |
Less: amortizable fees | -238 | -146 | -294 | - | -678 |
Less: ECL allowance | -556 | -1,694 | -96,145 | - | -98,395 |
Plus FV adjustments | - | - | - | -11,055 | -11,055 |
Carrying value | 34,586 | 22,557 | 23,397 | 63,666 | 144,206 |
Loans past due and impairments 2020 | |||||
Stage 1 | Stage 2 | Stage 3 | Fair value | Total | |
Loans not past due | 54,762 | 11,945 | 5,519 | 61,060 | 133,286 |
Loans past due: | |||||
-Past due up to 30 days | 8,610 | - | - | 8,363 | 16,973 |
-Past due 30-60 days | - | - | - | - | - |
-Past due 60-90 days | - | - | - | 4,598 | 4,598 |
-Past due more than 90 days | - | - | 103,446 | - | 103,446 |
Subtotal | 63,372 | 11,945 | 108,965 | 74,021 | 258,303 |
Less: amortizable fees | -586 | -68 | -259 | - | -913 |
Less: ECL allowance | -845 | -759 | -85,782 | - | -87,386 |
Plus FV adjustments | - | - | - | -1,862 | -1,862 |
Carrying value | 61,941 | 11,118 | 22,924 | 72,159 | 168,142 |
Stage 3 loans - ECL distributed by regions and sectors | ||||
At December 31, 2021 | Energy | Agribusiness | Infrastructure, Manufacturing, Services | Total |
Africa | -46,033 | -34,066 | - | -80,099 |
Asia | -8,129 | -5,046 | - | -13,175 |
Latin America & the Caribbean | - | - | -2,871 | -2,871 |
Total | -54,162 | -39,112 | -2,871 | -96,145 |
Stage 3 loans - ECL distributed by regions and sectors | ||||
At December 31, 2020 | Energy | Agribusiness | Infrastructure, Manufacturing, Services | Total |
Africa | -44,515 | -33,233 | - | -77,748 |
Asia | -3,578 | - | - | -3,578 |
Latin America & the Caribbean | -1,843 | - | -2,613 | -4,456 |
Total | -49,936 | -33,233 | -2,613 | -85,782 |
Modified financial assets
Changes in terms and conditions usually include extending the maturity, changing the interest margin and changing the timing of interest payments. When the terms and conditions are modified due to financial difficulties, these loans are qualified as forborne. Refer to paragraph related to 'Modification of financial assets' in Accounting Policies section
The watch-list process and the Credit department review modified loans periodically. When a loan is deemed no longer collectible, it is written off against the related loss allowance. In 2021, there were no write-offs (2020: €0.35 million).
The following table provides a summary of the Fund's forborne assets, both classified as performing and not, as of December 31.
December 31, 2021 | Performing | of which: performing but past due > 30 days and <=90 days | of which: performing forborne | Non Performing | of which: non performing forborne | of which: impaired | Sub Total | Less: amortizable fees | Less: ECL allowance | Plus: fair value adjustments | Carrying value |
Loan portfolio measured at AC | 59,777 | - | 21,173 | 119,836 | 45,932 | 45,932 | 179,613 | -678 | -98,395 | - | 80,540 |
Loan portfolio measured at FVPL | 40,157 | - | - | 42,299 | 14,394 | - | 82,456 | - | - | -11,055 | 71,401 |
Total | 99,934 | - | 21,173 | 162,135 | 60,326 | 45,932 | 262,069 | -678 | -98,395 | -11,055 | 151,941 |
December 31, 2020 | Performing | of which: performing but past due > 30 days and <=90 days | of which: performing forborne | Non Performing | of which: non performing forborne | of which: impaired | Sub Total | Less: amortizable fees | Less: ECL allowance | Plus: fair value adjustments | Carrying value |
Loan portfolio measured at AC | 75,317 | - | 8,307 | 108,965 | 29,220 | 108,965 | 184,282 | -913 | -87,386 | - | 95,983 |
Loan portfolio measured at FVPL | 65,658 | 4,598 | - | 8,363 | - | - | 74,021 | - | - | -1,862 | 72,159 |
Total | 140,975 | 4,598 | 8,307 | 117,328 | 29,220 | 114,601 | 258,303 | -913 | -87,386 | -1,862 | 168,142 |
Equity risk
Equity risk is the risk that the fair value of an equity investment decreases. It also includes exit risk, which is the risk that Fund’s stake cannot be sold for a reasonable price and in a sufficiently liquid market.
The Fund takes a long-term view of its equity portfolio, aiming to sell its equity stake within a period of five to ten years. The Fund can accommodate an increase in the average holding period of its equity investments and wait for markets to improve again to realize exits. The fund has no deadlines regarding the exit date of our equity investments. Equity investments are assessed by the Investment Committee in terms of specific obligor as well as country risk. The Investment Review Committee assesses the valuation of the majority of equity investments quarterly. The performance of the equity investments in the portfolio is periodically analyzed during the fair value process. Based on this performance and the market circumstances, exits are pursued in close cooperation with our co-investing partners. The total outstanding equity portfolio on December 31, 2021, amounts to €140.9 million (2020: €105.6 million) of which €76.3 million (2020: €50.6 million) is invested in investment funds.
Equity portfolio distributed by region and sector | ||||||||||
At December 31, 2021 | Energy | Agribusiness | Multi-Sector Fund Investments | Infrastructure, Manufacturing, Services | Total | |||||
Direct | Funds | Direct | Funds | Direct | Funds | Direct | Funds | Direct | Funds | |
Africa | 18,513 | 10,267 | 2,471 | 1,937 | - | 13,229 | 2,988 | - | 23,972 | 25,433 |
Asia | 9,850 | - | - | 7,851 | - | 27,961 | - | - | 9,850 | 35,812 |
Latin America & the Caribbean | - | - | - | - | - | 254 | - | - | - | 254 |
Europe & Central Asia | 3,254 | - | - | 3,990 | - | 5,245 | 25,701 | - | 28,955 | 9,235 |
Non-region specific | 261 | - | - | 6,445 | - | - | - | - | 261 | 6,445 |
Total | 31,878 | 10,267 | 2,471 | 20,223 | - | 46,689 | 28,689 | - | 63,038 | 77,179 |
Equity portfolio distributed by region and sector | ||||||||||
At December 31, 2020 | Energy | Agribusiness | Multi-Sector Fund Investments | Infrastructure, Manufacturing, Services | Total | |||||
Direct | Funds | Direct | Funds | Direct | Funds | Direct | Funds | Direct | Funds | |
Africa | 14,842 | 8,431 | 238 | 1,860 | - | 7,945 | 29,587 | - | 44,667 | 18,236 |
Asia | 1,309 | 814 | - | 2,519 | - | 15,428 | - | - | 1,309 | 18,761 |
Latin America & the Caribbean | - | - | - | - | - | - | - | - | - | - |
Europe & Central Asia | 1,210 | - | - | 4,391 | - | - | - | - | 1,210 | 4,391 |
Non-region specific | 10,252 | - | - | 856 | - | 8,433 | - | - | 10,252 | 9,289 |
Total | 27,613 | 9,245 | 238 | 9,626 | - | 31,806 | 29,587 | - | 57,438 | 50,677 |
Concentration risk
Country risk
Country risk arises from country-specific events that adversely impact the Fund’s exposure in a specific country. Within FMO, country risk is broadly defined. It includes all relevant factors that have a common impact on the Fund’s portfolio in a country such as economic, banking and currency crises, sovereign default and political risk events. The assessment of the country rating is based on a benchmark of external rating agencies and other external information.
In the fund risk appetite, the country risk exposure for BP is set at a maximum of 40% of the total portfolio.
FMO recognizes that the impact of country risk differs across the financial products it offers. Multiple countries and regions were subject to a downgrade throughout 2021. In 2021, Kenya, Myanmar and Nepal were downgraded by one or more notches, in which BP’s exposure amounted around 12% of the total committed portfolio. Building Prospects has several investments which cover multiple countries, which are labeled as regional investments. Therefore, the downgrades of the regions Asia and Africa are noteworthy as well, as circa 24% of the total committed portfolio is labeled as regional investments in these two regions
The following tables present how the Fund’s loan portfolio is concentrated according to country ratings. The comparison with FMO demonstrates that loan portfolio of the Fund is concentrated in countries with higher ratings and is relatively prone to higher credit risk.
Overview country ratings BP Portfolio | ||
Indicative external rating equivalent 2021 | BP (%) | FMO-A (%) |
F9 and higher (BBB and higher ratings) | 8.1 | 2.5 |
F10 (BBB-) | 8.8 | 7.3 |
F11 (BB+) | 0.0 | 2.2 |
F12 (BB) | 0.0 | 5.3 |
F13 (BB-) | 6.6 | 11.5 |
F14 (B+) | 17.0 | 26.6 |
F15 (B) | 10.8 | 22.0 |
F16 (B-) | 20.0 | 10.5 |
F17 and lower (CCC+ and lower ratings) | 28.7 | 12.1 |
Total | 100.0 | 100.0 |
Overview country ratings BP Portfolio | ||
Indicative external rating equivalent 2020 | BP (%) | FMO-A (%) |
F9 and higher (BBB and higher ratings) | 9.1 | 3.4 |
F10 (BBB-) | 7.8 | 8.5 |
F11 (BB+) | 0.0 | 2.3 |
F12 (BB) | 2.2 | 5.9 |
F13 (BB-) | 0.0 | 7.5 |
F14 (B+) | 30.1 | 30.1 |
F15 (B) | 31.4 | 24.2 |
F16 (B-) | 11.1 | 8.1 |
F17 and lower (CCC+ and lower ratings) | 8.3 | 10.0 |
Total | 100.0 | 100.0 |
Gross exposure of loan portfolio distributed by region and sector | ||||
Energy | Agribusiness | Infrastructure, Manufacturing, Services | Total | |
At December 31, 2021 | ||||
Africa | 64,476 | 69,258 | 8,295 | 142,029 |
Asia | 20,954 | 29,467 | 20,170 | 70,591 |
Latin America & the Caribbean | 6,009 | 21,608 | 6,532 | 34,149 |
Non-region specific | 7,042 | 523 | - | 7,565 |
Total | 98,481 | 120,856 | 34,997 | 254,334 |
At December 31, 2020 | ||||
Africa | 55,266 | 74,279 | 8,622 | 138,167 |
Asia | 19,770 | 24,846 | 24,025 | 68,641 |
Latin America & the Caribbean | 17,366 | 18,556 | 5,902 | 41,824 |
Non-region specific | 9,669 | 2 | - | 9,671 |
Total | 102,071 | 117,683 | 38,549 | 258,303 |
Single and group risk exposures
In the fund risk appetite the maximum customer exposure for BP is set at 10% of the total portfolio.
Counterparty credit risk
Credit risk in the treasury portfolio stems from bank account holdings and placements in money market instruments to manage the liquidity in the Fund. The Risk department approves each obligor to which the Fund is exposed through its treasury activities and sets a maximum limit for the credit exposure of that obligor. Depending on the obligor’s short and long-term rating, limits are set for the total and long-term exposure. The Fund pursues a conservative investment policy.
Liquidity risk
Liquidity risk is the risk of not being able to fulfil the financial obligations and meet financial commitments due to insufficient availability of liquid means. The Fund aims to maintain adequate liquidity buffers, enough to support the implementation of the Fund’s development agenda and impact objectives while avoiding putting pressure on Dutch Ministry of Foreign Affairs DGIS subsidy budget allocated to the Fund. To realize this ambition, the Fund benefits from the experience of FMO’s treasury and risk management functions in managing the liquidity risk, which primarily involves periodical forecasting of the Fund’s liquidity position under normal and stress scenarios. During these periodical exercises, the assumptions underlying the liquidity model are reviewed. Changes in expected cashflows, stemming from updated portfolio management strategies and changes in the Fund’s operating environment, are reflected in the said assumptions. As a result of the forecasting activity, the predicted liquidity shortfall is avoided through arrangements in investments portfolio. If possible this is done through the utilisation of the subsidies available from the budget allocated to the Fund by the Dutch Ministry of Foreign Affairs DGIS (‘beschikkingsruimte’); and lastly, through the request of a loan from FMO, not exceeding 10% of the Fund’s net committed portfolio. In requesting subsidies that will be made available to the Fund’s utilization from Dutch Ministry of Foreign Affairs, the Fund administrators strictly follow the Ministry's directives.
Market risk
Market risk can be divided into interest rate risk and currency risk.
Interest rate risk
Interest rate risk is the risk of potential loss due to adverse movements in interest rates. Changing interest rates mainly have an effect on the fair value of fixed interest balance sheet items. Given the balance sheet and capital structure of the Fund interest rate risks are considered limited.
Interest re-pricing characteristics | ||||||
December 31, 2021 | <3 months | 3-12 months | 1-5 years | >5 years | Non-interest-bearing | Total |
Assets | ||||||
Banks | 30,020 | - | - | - | - | 30,020 |
Short-term deposits | 14,082 | - | - | - | - | 14,082 |
Derivative financial instruments | - | - | - | - | 2,988 | 2,988 |
Loan portfolio | - | |||||
-of which: Amortized cost | 4,202 | 35,264 | 4,025 | 37,049 | - | 80,540 |
-of which: Fair value through profit or loss | 16,736 | 24,398 | 22,532 | - | - | 63,666 |
Equity investments: Fair value through profit or loss | - | - | - | - | 140,217 | 140,217 |
Current accounts with State funds and other programs | - | - | - | - | 76 | 76 |
Other receivables | - | - | - | - | 134 | 134 |
Total assets | 65,039 | 59,662 | 26,558 | 37,049 | 143,415 | 331,723 |
Liabilities and Fund capital | ||||||
Accrued liabilities | - | - | - | - | 1,736 | 1,736 |
Provisions | - | - | - | - | 73 | 73 |
Fund Capital | - | - | - | - | 329,914 | 329,914 |
Total liabilities and Fund capital | - | - | - | - | 331,723 | 331,723 |
Interest sensitivity gap 2021 | 65,039 | 59,662 | 26,558 | 37,049 | -188,308 | - |
Interest re-pricing characteristics | ||||||
December 31, 2020 | <3 months | 3-12 months | 1-5 years | >5 years | Non-interest-bearing | Total |
Assets | ||||||
Banks | 24,204 | - | - | - | - | 24,204 |
Short-term deposits | 9,833 | - | - | - | - | 9,833 |
Derivative financial instruments1 | - | - | - | - | 2,780 | 2,780 |
Loan portfolio | ||||||
-of which: Amortized cost | 19,614 | 21,578 | 10,794 | 43,997 | - | 95,983 |
-of which: Fair value through profit or loss | 3,870 | 16,585 | 25,144 | 26,560 | - | 72,159 |
Equity investments: Fair value through profit or loss | - | - | - | - | 108,115 | 108,115 |
Investments in associates | - | - | - | - | - | - |
Current accounts with State funds and other programs | - | - | - | - | 23 | 23 |
Other receivables | - | - | - | - | 651 | 651 |
Total assets | 58,195 | 38,163 | 35,938 | 70,557 | 110,895 | 313,748 |
Liabilities and Fund capital | ||||||
Accrued liabilities | - | - | - | - | 1,990 | 1,990 |
Provisions | - | - | - | - | 135 | 135 |
Other liabilities | - | - | - | - | - | - |
Fund Capital | - | - | - | - | 311,623 | 311,623 |
Total liabilities and Fund capital | 1,990 | - | - | - | 311,758 | 313,748 |
Interest sensitivity gap 2020 | 56,205 | 38,163 | 35,938 | 70,557 | -200,863 |
Currency risk
Currency risk is defined as the risk of having an adverse effect on the value of the Fund’s financial position and future cash flows due to changes in foreign currency exchange rates. The Fund offers debt, equity and guarantee instruments in denominated in USD, EUR and partly in emerging market currencies, while the main source of funding to the Fund, subsidies received from Dutch Ministry of Foreign Affairs is in EUR. The Fund targets to invest in USD as a risk-averse alternative to investing in local currencies when possible; additionally, cash inflows denominated in local currencies are converted to hard currencies when received. Due to its commitment to the implementation of the Fund’s development agenda and impact objectives, the Fund does not exclusively look for investments that counter-balance this currency risk exposure in its portfolio; the Fund also does not use derivatives and other financial instruments to hedge against the currency risk, and avoids bearing the cost of these engineered measures. The Fund does not take active positions in any currency for the purpose of making a profit.
Currency risk exposure (at carrying values) | |||||
December 31, 2021 | EUR | USD | XOF | Other | Total |
Assets | |||||
Banks | 23,773 | 6,247 | - | - | 30,020 |
Short-term deposits | 21 | 14,061 | - | 14,082 | |
Derivative financial instruments | - | 2,988 | 2,988 | ||
Loan portfolio | - | ||||
-of which: Amortized cost | 24,639 | 55,901 | 80,540 | ||
-of which: Fair value through profit or loss | 527 | 63,139 | 63,666 | ||
Equity investments: Fair value through profit or loss | 29,513 | 105,664 | 2,988 | 2,052 | 140,217 |
Current account with FMO | 76 | 76 | |||
Other receivables | 48 | 86 | 134 | ||
Total assets | 78,597 | 248,086 | 2,988 | 2,052 | 331,723 |
Liabilities and Fund capital | |||||
Accrued liabilities | 1,736 | 1,736 | |||
Provisions | 58 | 15 | 73 | ||
Fund Capital | 329,914 | 329,914 | |||
Total liabilities and Fund capital | 331,708 | 15 | - | - | 331,723 |
Currency sensitivity gap 2021 | 248,071 | 2,988 | 2,052 | ||
Currency sensitivity gap 2021 excluding equity investments and investments in associates | 142,407 | - | - |
Currency risk exposure (at carrying values) | ||||||
December 31, 2020 | EUR | USD | XOF | GTQ | Other | Total |
Assets | ||||||
Banks | 18,239 | 5,965 | - | - | - | 24,204 |
Short-term deposits | 21 | 9,812 | - | - | - | 9,833 |
Derivative financial instruments | - | 2,780 | - | - | - | 2,780 |
Loan portfolio | ||||||
-of which: Amortized cost | 29,437 | 59,842 | - | 3,677 | 3,027 | 95,983 |
-of which: Fair value through profit or loss | 1,194 | 70,965 | - | - | - | 72,159 |
Equity investments: Fair value through profit or loss | 14,451 | 89,337 | 3,019 | - | 1,308 | 108,115 |
Current account with FMO | 23 | - | - | - | - | 23 |
Other receivables | 94 | 557 | - | - | - | 651 |
Total assets | 63,459 | 239,258 | 3,019 | 3,677 | 4,335 | 313,748 |
Liabilities and Fund capital | ||||||
Accrued liabilities | 1,990 | - | - | - | - | 1,990 |
Provisions | 95 | 40 | - | - | - | 135 |
Fund Capital | 311,623 | - | - | - | - | 311,623 |
Total liabilities and Fund capital | 313,708 | 40 | - | - | - | 313,748 |
Currency sensitivity gap 2020 | 239,218 | 3,019 | 3,677 | 4,335 | ||
Currency sensitivity gap 2020 excluding equity investments and investments in associates | 149,881 | - | 3,677 | 3,027 |
Sensitivity of profit & loss account and fund capital to main foreign currencies | ||
IFRS 9 December 31, 2021 | ||
Change of value relative to the euro | Sensitivity of profit & loss account | Sensitivity of shareholders’ equity |
USD value increase of 10% | 24,807 | - |
USD value decrease of 10% | -24,807 | - |
XOF value increase of 10% | 299 | - |
XOF value decrease of 10% | -299 | - |
Sensitivity of profit & loss account and fund capital to main foreign currencies | ||
IFRS 9 December 31, 2020 | ||
Change of value relative to the euro | Sensitivity of profit & loss account | Sensitivity of shareholders’ equity |
USD value increase of 10% | 23,922 | - |
USD value decrease of 10% | -23,922 | - |
XOF value increase of 10% | 302 | - |
XOF value decrease of 10% | -302 | - |
GTQ value increase of 10% | 368 | - |
GTQ value decrease of 10% | -368 | - |
Non-financial risk
Environmental, social and governance risk
Environmental & Social (E&S) risk refers to potential adverse impacts of the Fund’s investments on the environment, employees, communities, or other stakeholders. Corporate Governance (G) risks refers primarily to risk to customer business. ESG risks can lead to non-compliance with applicable regulation, NGO and press attention or reputation damage. These risks stem from the nature of the Fund’s projects in difficult markets, where regulations on ESG are less institutionalized.
The Fund has an appetite for managed risk in portfolio, accepting ESG performance below standards when starting to work with a customer, with the goal that performance is brought in line with our ESG risk mitigation requirements within a credible and reasonable period. ESG risks are mitigated through environmental and social action plans and monitoring. The risk appetite for deviations from the exclusion list and human rights violations is zero.
As part of the investment process, all customers are screened on ESG risk and categorizes them according to the ESG risk that their activities represent. FMO assesses in detail customers with a high ESG risk category to identify ESG impact and risks and to assess the quality of existing risk management and mitigation measures. Due diligence also includes an analysis of contextual and human rights risk. In case of gaps in ESG risk management, FMO works with customers to develop and implement an Action Plan to avoid adverse ESG impacts and/or to improve ESG risk management over time. Key ESG risk items are tracked during the tenor of the engagement. FMO’s ESG risk management support to customers is an important part of development impact ambitions.
In addition, for customers with a high ESG category, FMO monitors customer performance on key ESG risk themes (against the IFC Performance Standards) using the ESG Performance Tracker (ESG-PT). The ESG-PT keeps track of key ESG risks and customer performance level, enabling FMO to have a portfolio-wide view of its ESG risks.
Compliance risk
Compliance Risk is the risk of failure to comply with laws, regulations, rules, related self-regulatory organization, standards and codes of conduct applicable to FMO’s services and activities.
Fund’s customers follow FMO’s procedures to mitigate compliance risk. FMO’s standards and policies and good business practices foster acting with integrity. FMO’s standards and policies and good business practices foster acting with integrity. FMO is committed to its employees, customers, and counterparties, adhering to high ethical standards. FMO has a Compliance framework which entails identifying risks, designing policies, monitoring, training, and providing advice. FMO has policies on topics such as financial economic crime (including KYC, sanctions, anti-bribery, and corruption) conflicts of interest, anti-fraud, private investments, protection of personal data and speak-up. FMO also regularly trains its employees to raise awareness by means of e.g., virtual classroom trainings and mandatory compliance related e- learnings. Employees are also encouraged to speak up in case of suspected integrity violations conducted by a FMO employee.
Management is periodically informed via the Compliance Committee or when required on an ad-hoc basis, on integrity related matters at customer or employee level. In case of signals of violations, e.g., money laundering, fraud or corruption, management will take appropriate actions. For example, initiating a dialogue with the customer, if possible and appropriate given the circumstances, to understand the background to be able to assess and investigate the severity. When FMO is of the opinion that there is a breach of law that cannot be remedied or that no improvement by the customer will be achieved (e.g. awareness, implementing controls) or that the risk to FMO’s reputation is unacceptably high, FMO may be able to exercise certain remedies under the contract such as the right to cancel a loan or suspend upcoming disbursements and will report to regulatory authorities if deemed necessary.
The governance of compliance also entails the following key risks:
Financial Economic Crime, incl. sanctions
FMO’s financial economic crime procedures include, amongst others, screening of customers on compliance with applicable anti-money laundering, counter financing of terrorism and international sanctions laws and regulations. Due diligence is performed on customers, which includes checks such as identifying and verifying the ultimate beneficial owners of the customer we finance, identifying politically exposed persons, and screening against relevant international sanctions lists. These checks are also performed regularly during the relationship with existing customers.
In 2021, FMO continued the FEC Enhancement program initiated in 2019 and met the agreed deadline with DNB to finalize the remediation project on December 31, 2021. All active KYC-files are remediated – using a new KYC tool - and meet the standards of the renewed CDD-AML Policy and CDD-AML Manual. In the second half of 2021, the renewed KYC organization was implemented in the front-office (first line) and business as usual processes were restarted, amongst others periodic reviews of KYC-files. Independent external validation confirmed that the remediated efforts and KYC files are demonstrably compliant with the relevant requirements, after which the Management Board provided a compliance statement to DNB end of 2021. The validation identified several recommendations that FMO will follow up on in 2022.
There is always a risk that a customer is involved or alleged to be involved in illicit acts (e.g., money laundering, fraud, or corruption). If such an event occurs, FMO will initiate a dialogue with the customer, if possible and appropriate given the circumstances, to understand the background to be able to assess and investigate the severity. When FMO is of the opinion that there is a breach of law that cannot be remedied or that no improvement by the customer will be achieved (e.g. awareness, implementing controls) or that the risk to FMO’s reputation is unacceptably high, FMO may be able to exercise certain remedies under the contract such as the right to cancel a loan or suspend upcoming disbursements and will report to regulatory authorities if deemed necessary.
General Data Protection Act (GDPR)
In 2021, FMO started a project to further develop and enhance privacy data protection capabilities including engaging a dedicated privacy officer and privacy champions within various departments. Specific trainings will be deployed to stimulate awareness. The project aims to finish in 2022. The privacy officer monitors FMOs privacy compliance periodically. The privacy officer is involved in i.e., change management activities and new projects to advise on privacy risks and risk mitigation
Corruption
Corruption is a global problem, requiring a global response. FMO is guided by the OECD Convention on Combating Bribery and the UN Convention against Corruption and is dedicated to fighting corruption and bribery not only to adhere to the law, but also because such acts undermine sustainable development and the achievement of higher levels of economic and social welfare. Good governance, fair business practices and public trust in the private sector is necessary to unlock the full potential of an economy and its citizens. Corruption can be best prevented collaboratively and FMO actively supports the Transparency International’s Netherlands branch and the International Chamber of Commerce to share best practices and stimulate the dialogue between Dutch corporates on best practices in doing international business.
Operational risk
Operational risk is defined as the risk of loss resulting from inadequate or failed internal processes, people, and systems, or from external events, including legal risks, excluding strategic risks. Operational risks are not actively sought and have no direct material upside in terms of return/income generation, yet operational risk events are inherent in operating a business. Operational risk events can result in non-compliance with applicable (internal and external) standards, losses, misstatements in the financial reports, and reputational damage.
Overall, FMO is cautious with operational risks. Safe options, with low inherent risk are preferred, despite consequence of limited rewards (or higher costs). There is no appetite for high residual risk. Risk metrics are reported on a quarterly basis. These metrics cover operational risks in general, such as the amount of loss per quarter and timely follow-up of management actions, and specific metrics for risk-(sub)types.
Management of the first line of defense is primarily responsible for managing (embedded) risks in the day-to-day business processes. The first line acts within the risk management framework and supporting guidelines defined by specialized risk functions that make up the second line of defense. Internal Audit in its role of the third line of defense provides independent assurance on the effectiveness of the first and second lines.
Departmental risk control self-assessments are conducted annually to identify and assess risks and corresponding controls. The strategy and business objectives are also reviewed annually by the Directors in a risk perspective. Based on among others these Risk and Control Self Assessments, the Directors sign a departmental In Control Statement at the year-end, which provides the underpinning for the management declaration in the Annual Report. Despite all preventive measures, operational risk events will occur. FMO systematically collects risk event information and analyses such events to take appropriate actions.